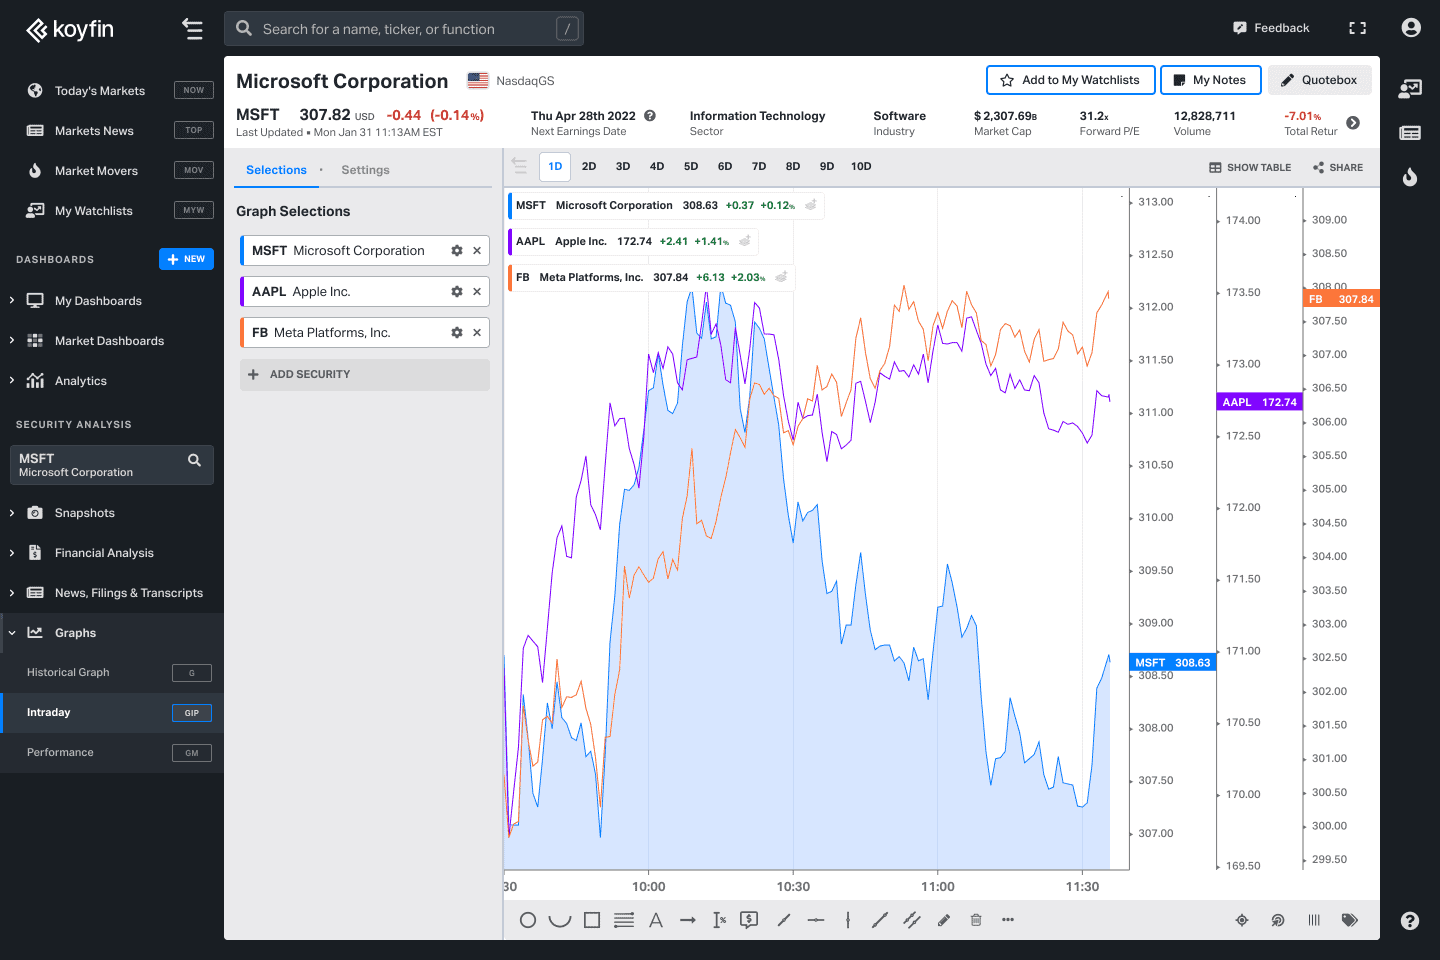
Advanced Graphing
Financial Analysis
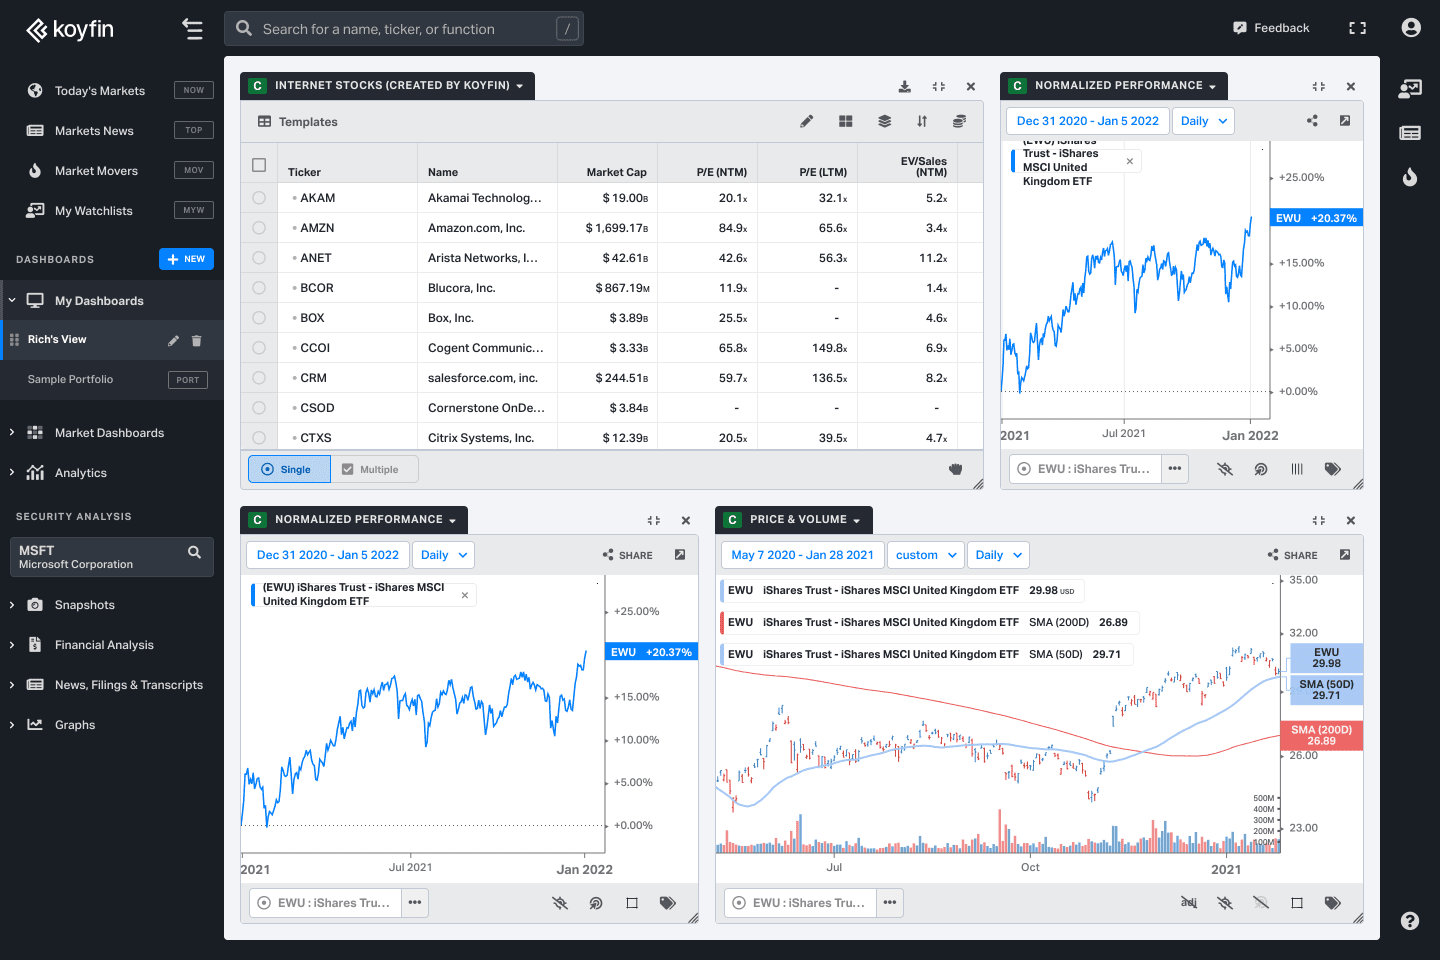
Core financial overview
Cut through the clutter of financial statements and see key
valuation metrics in a flash.
In depth
Easily see detailed analysis of company financial and key valuation metrics in an instant.
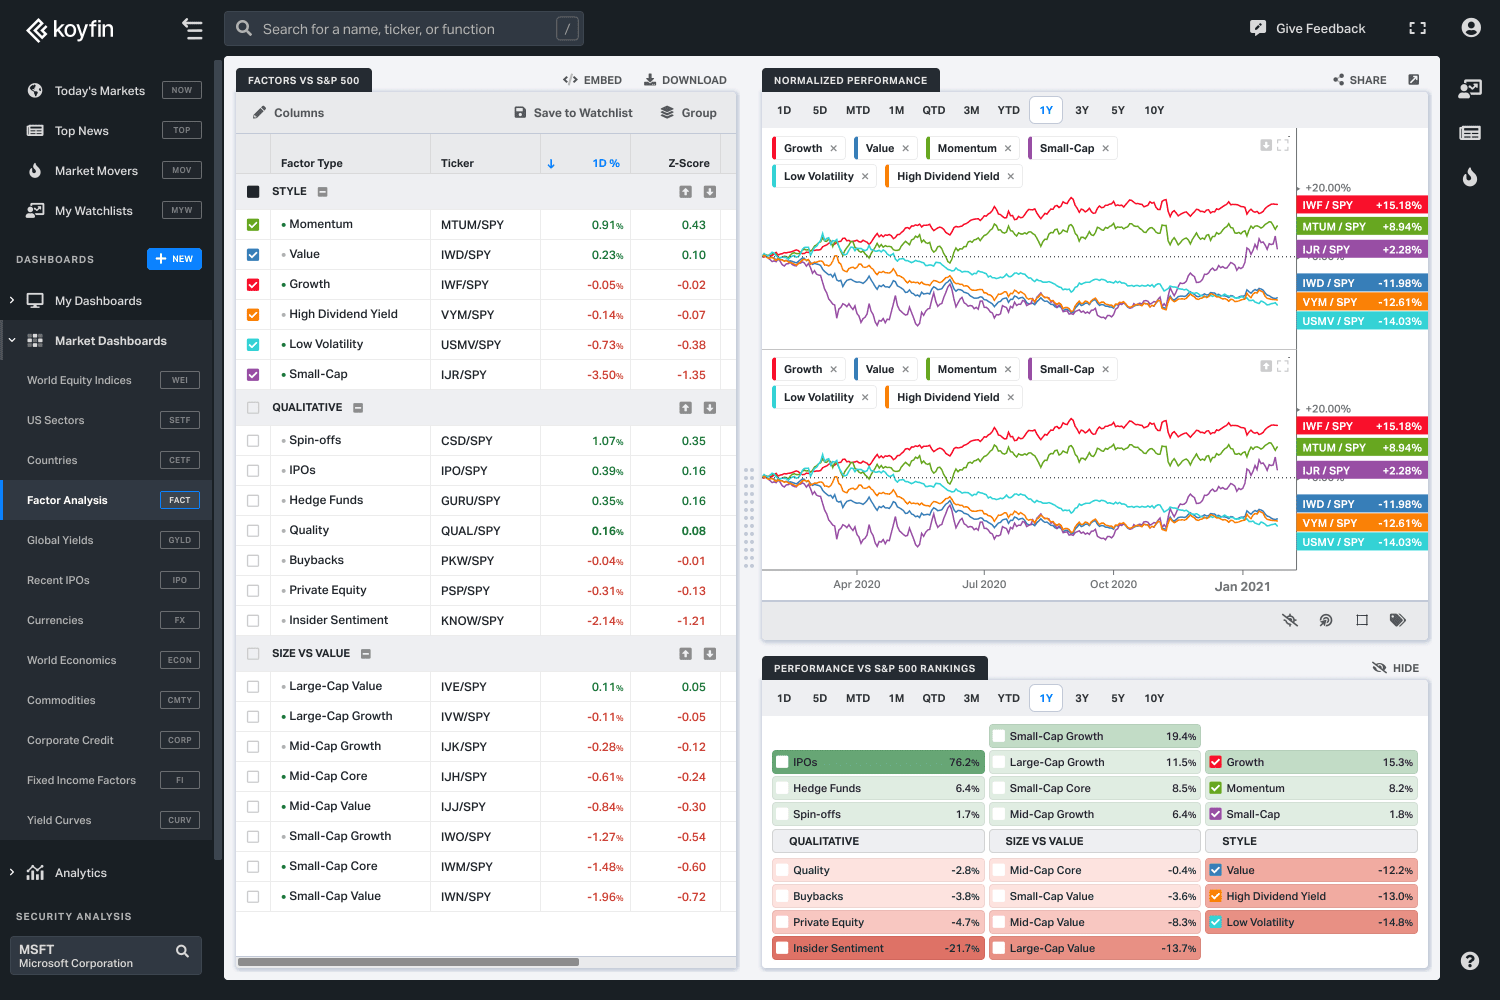
Customizable
Customize top-line criteria to highlight what’s most important to you.
Instant overviews
Get detailed company overviews in an instant. Save them to view any time you like.
Historical data
Review quarterly and annual data with the professional perspective you need.
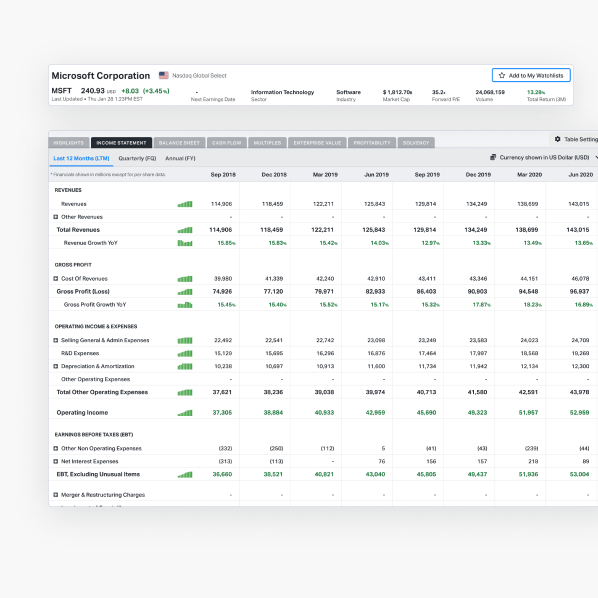
Financial statement review
Easily analyze company’s financials
Gain quick insight into all the vital aspects of company financials by seeing highlights of balance sheets, income, and cash-flow statements. Save them to your dashboard for instant recall.
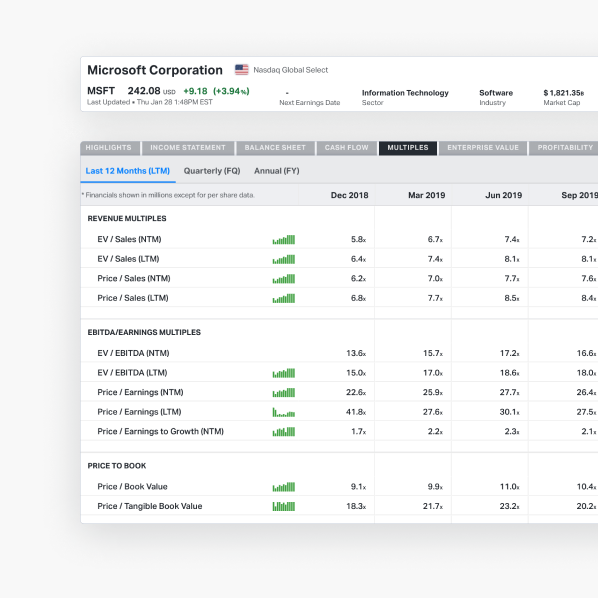
Valuation analysis
Detailed overview on one page
You want detail, but you want it instant and transparent. You've got it! See it all on the financial statements page — graphically or in the easy-to-read column format. Koyfin lets you highlight what's most important.
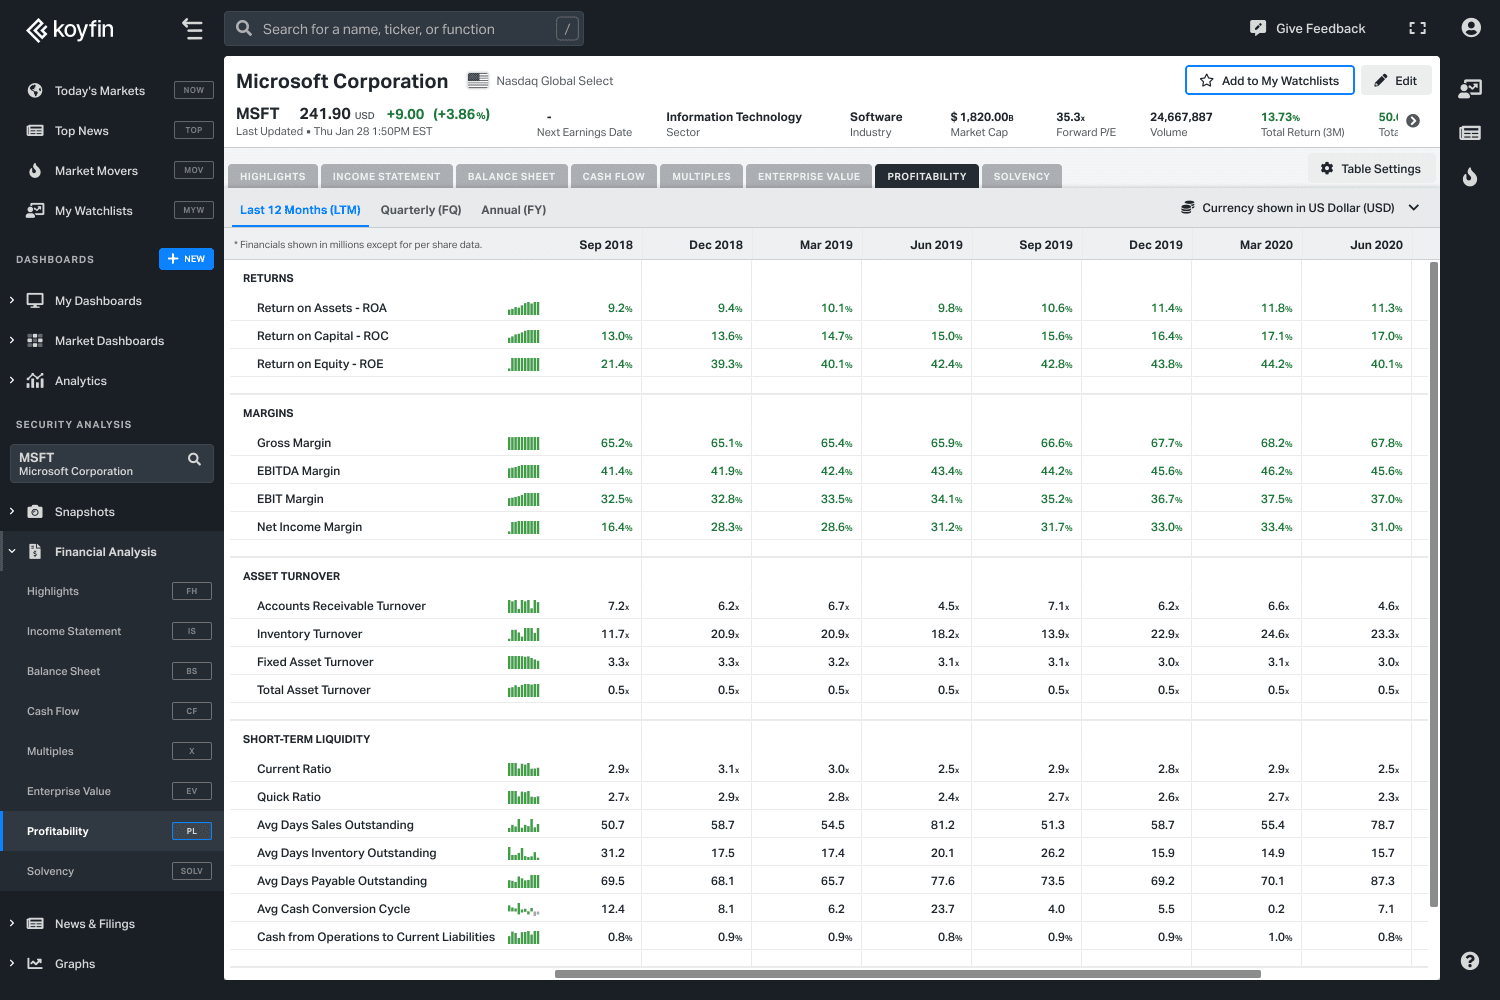
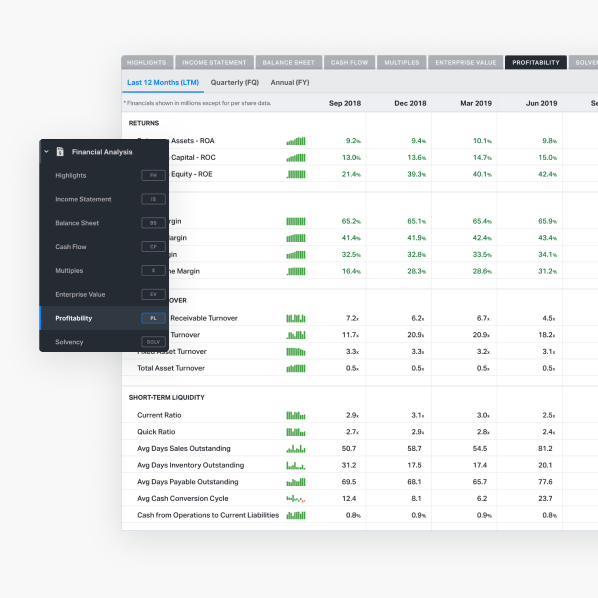
Viability analysis
Dig deeper
Delve into the fundamental metrics securities analysts rely on most, such as profitability, efficiency, and liquidity ratios. Uncover hidden patterns by toggling between tabular and graphic views.
Explore our other features
Great investments start with
great insight.
Save time, gain insight and revolutionize the way you invest. Get started today.