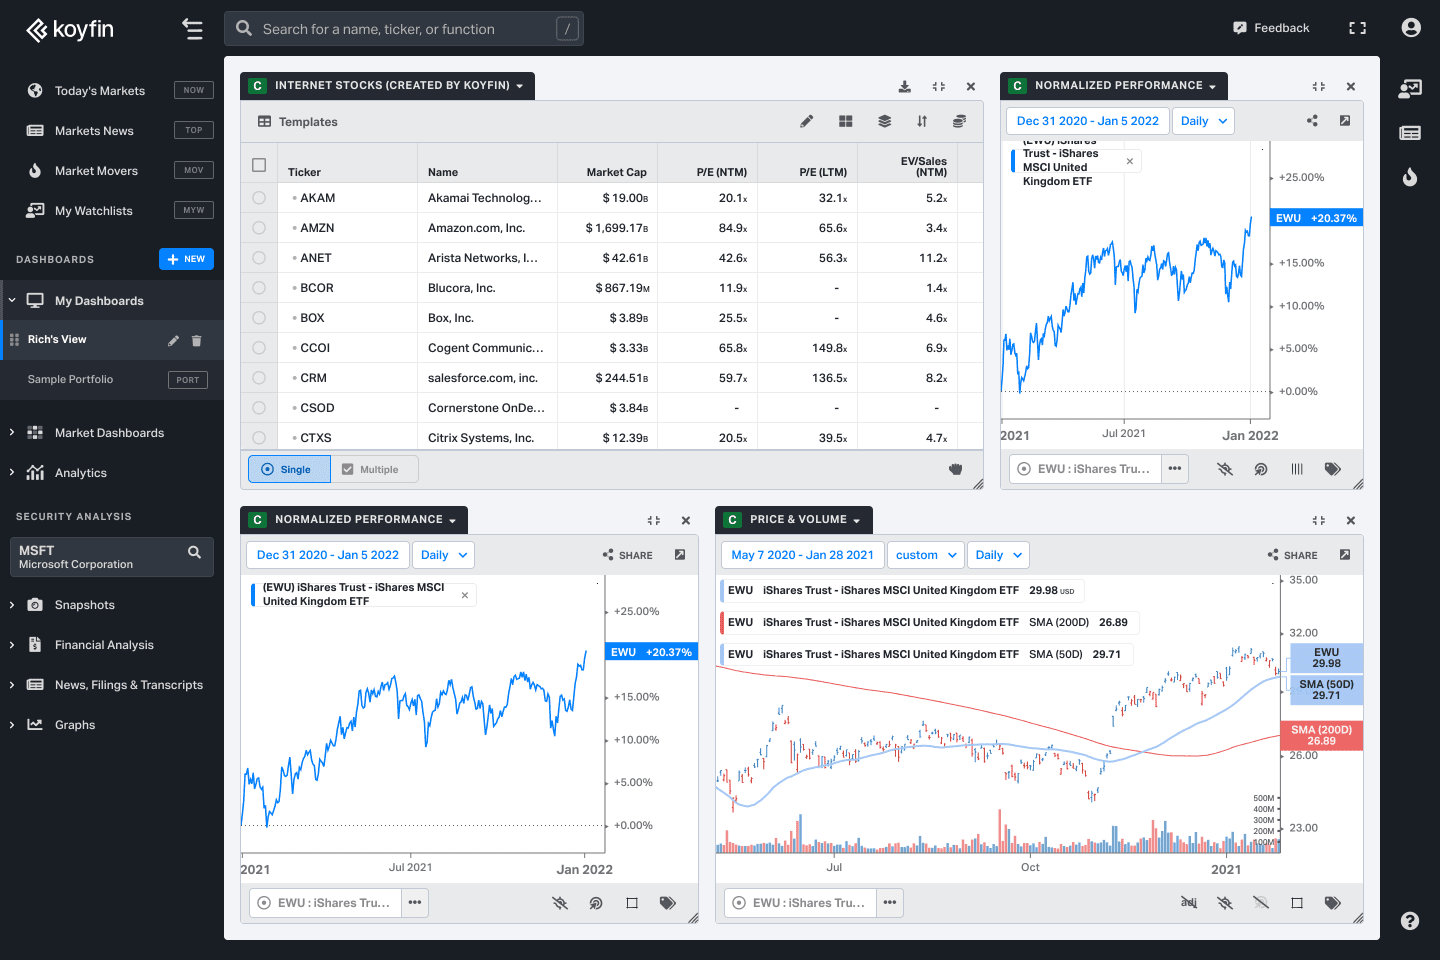
Custom Dashboards
Advanced Graphing
Graph like never before
Unlock insight with winning graphing tools that let you spot trends and identify investment opportunities with ease.
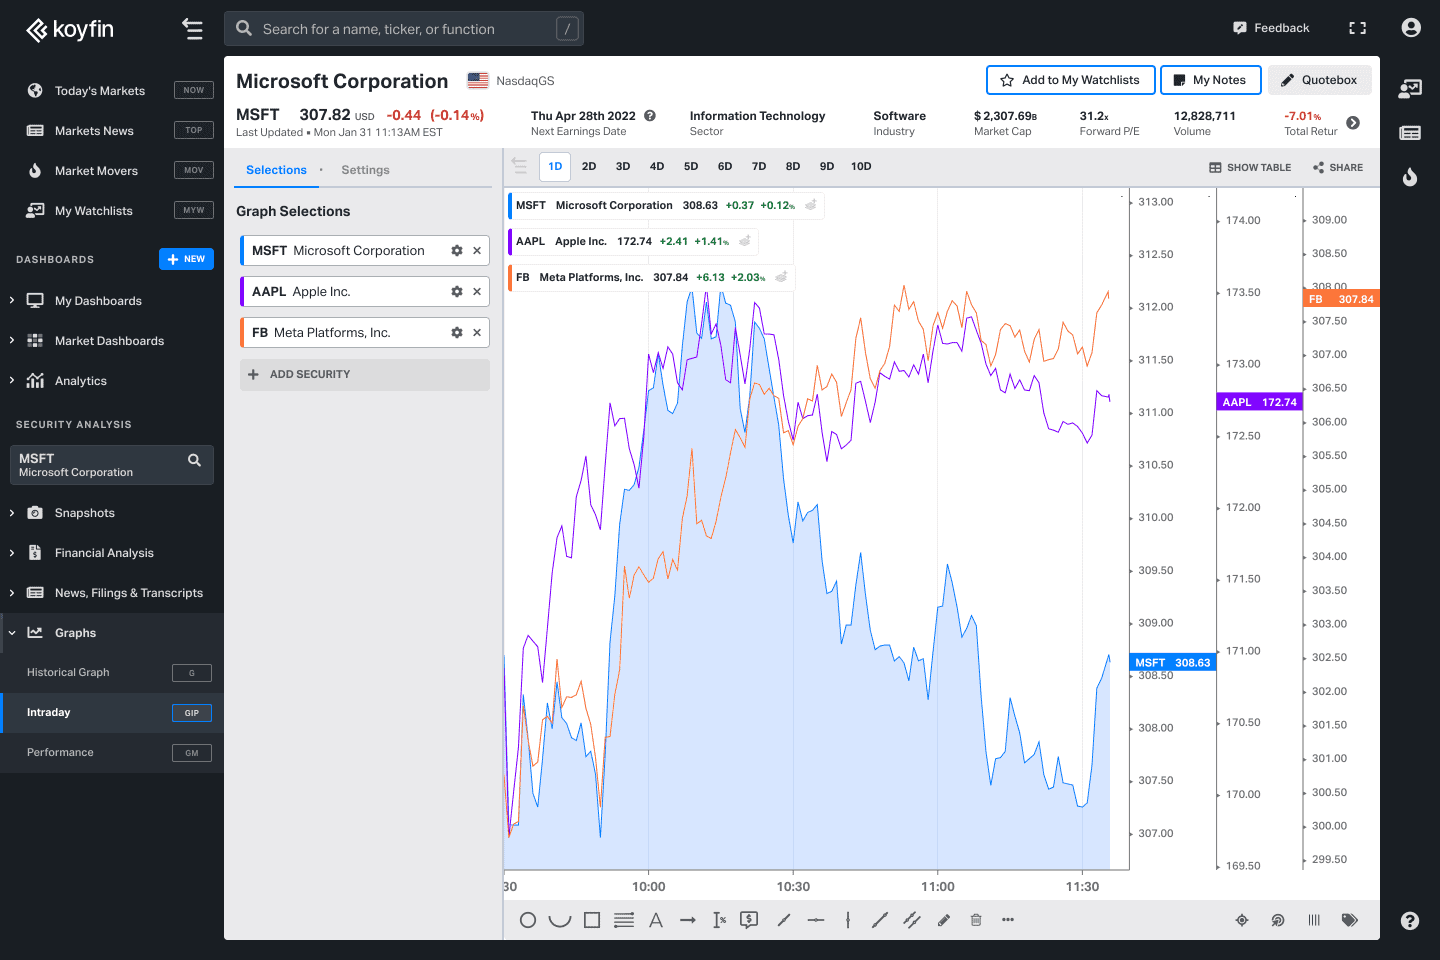
Powerful
Our graphs let you analyze assets with lazer like focus. With great graphs, comes great responsibility.
Customizable
Easily apply all your favorite indicators to make your graphs shine like never before.
Intuitive
With our focus on the user experience, you'll find our graphs a joy to use!
Responsive
Get your work done on any device, no matter the screen size, with our responsive graphing tools.
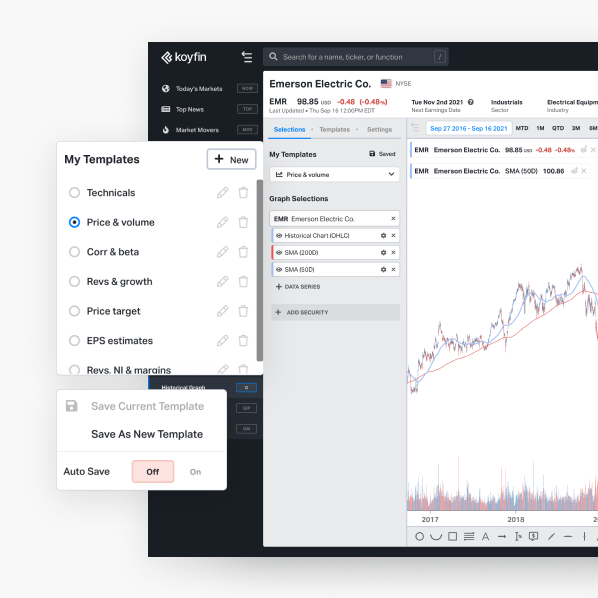
Save templates
Adapt and save templates
Koyfin lets you build your graphs to match how you work best. Templates let you apply your favorite views again and again!
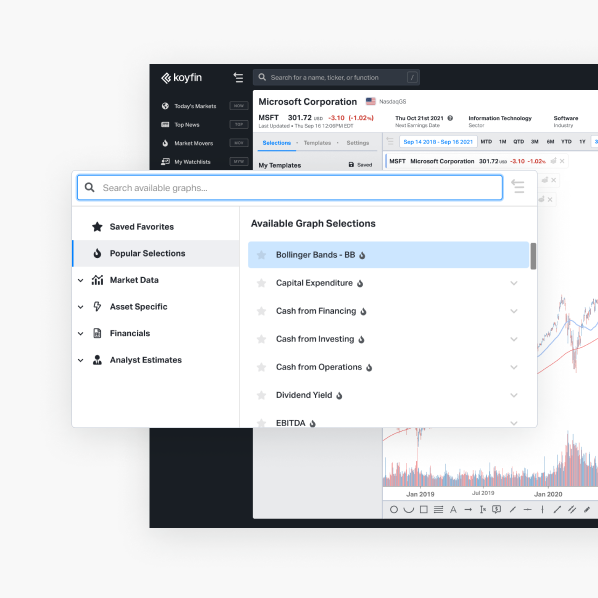
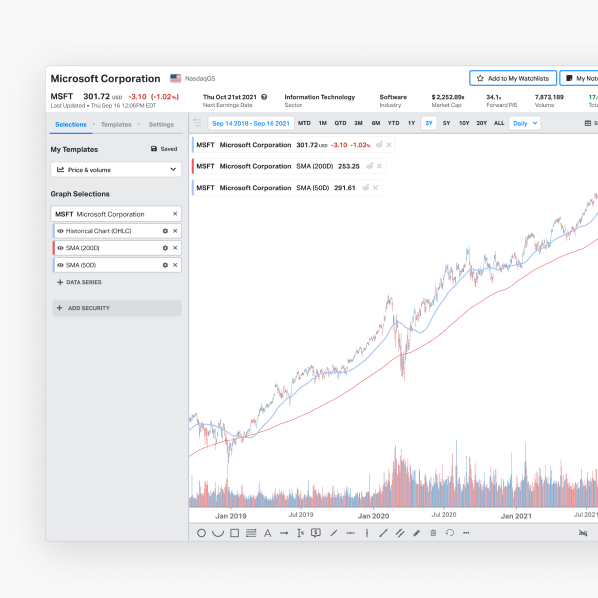
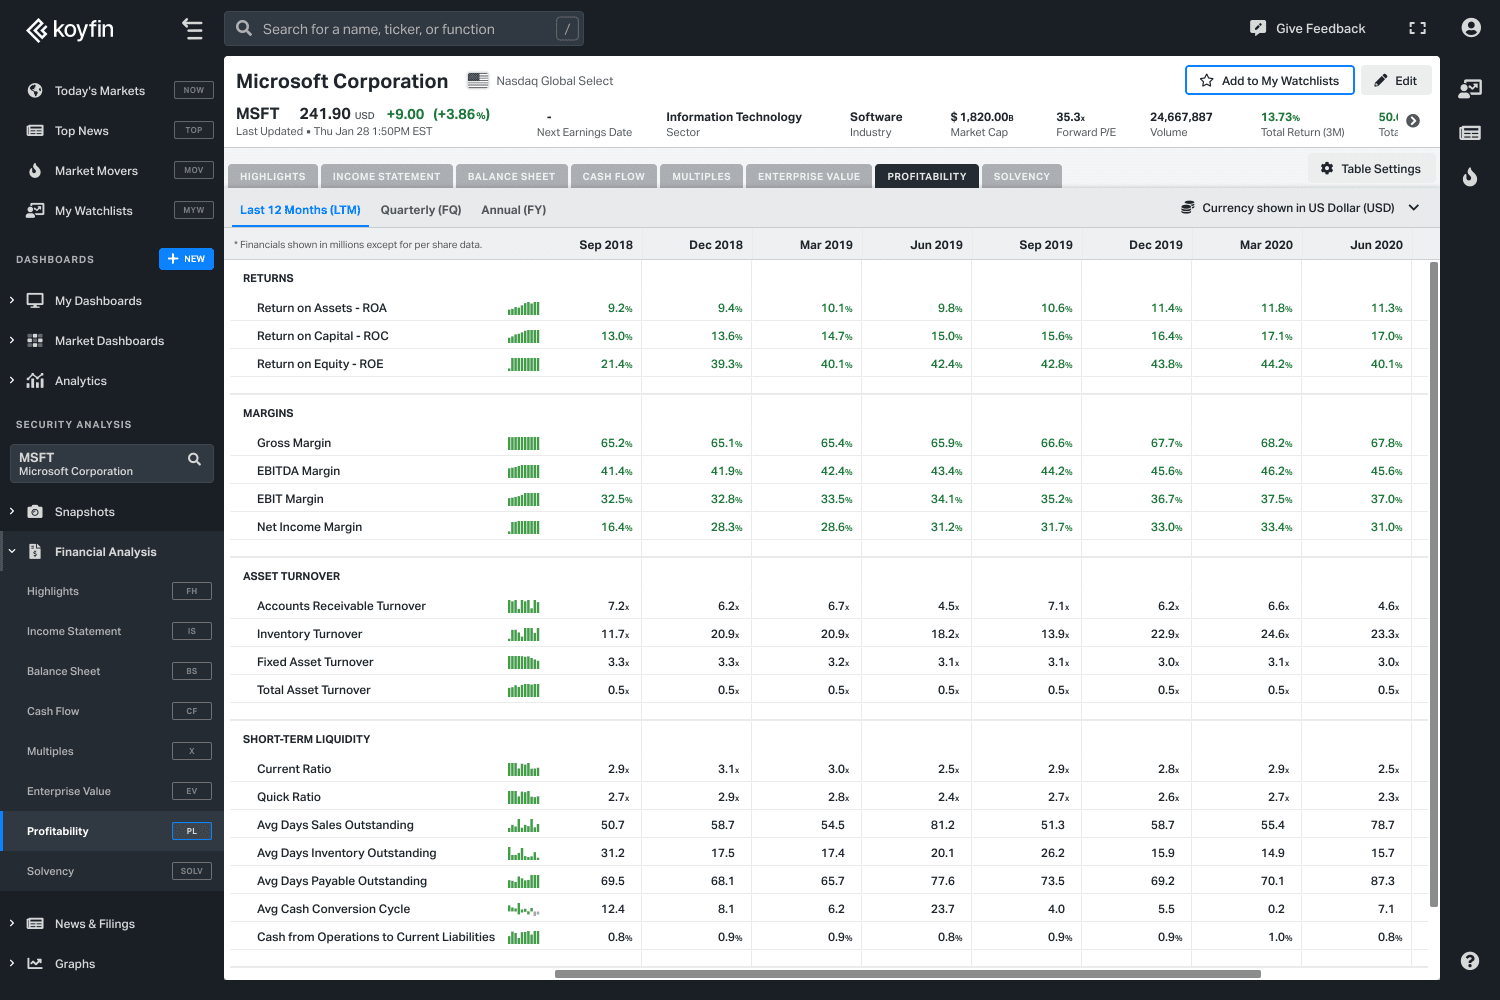
Technicals & fundamentals
Over 100 indicators
at your disposal
Our graphs can include over 100 different fundamental, technical, and valuation indicators. Plus, you can add notes or markers to identify movers.
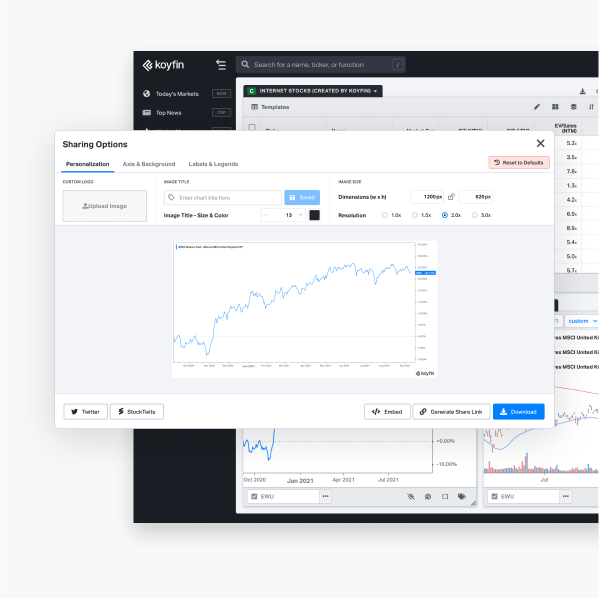
Easily share your insight
Share your charts with a mouse click
Share your charts with an easy link, or choose "embed" to easily add them to your website. Download your graphs to use in presentations or emails.
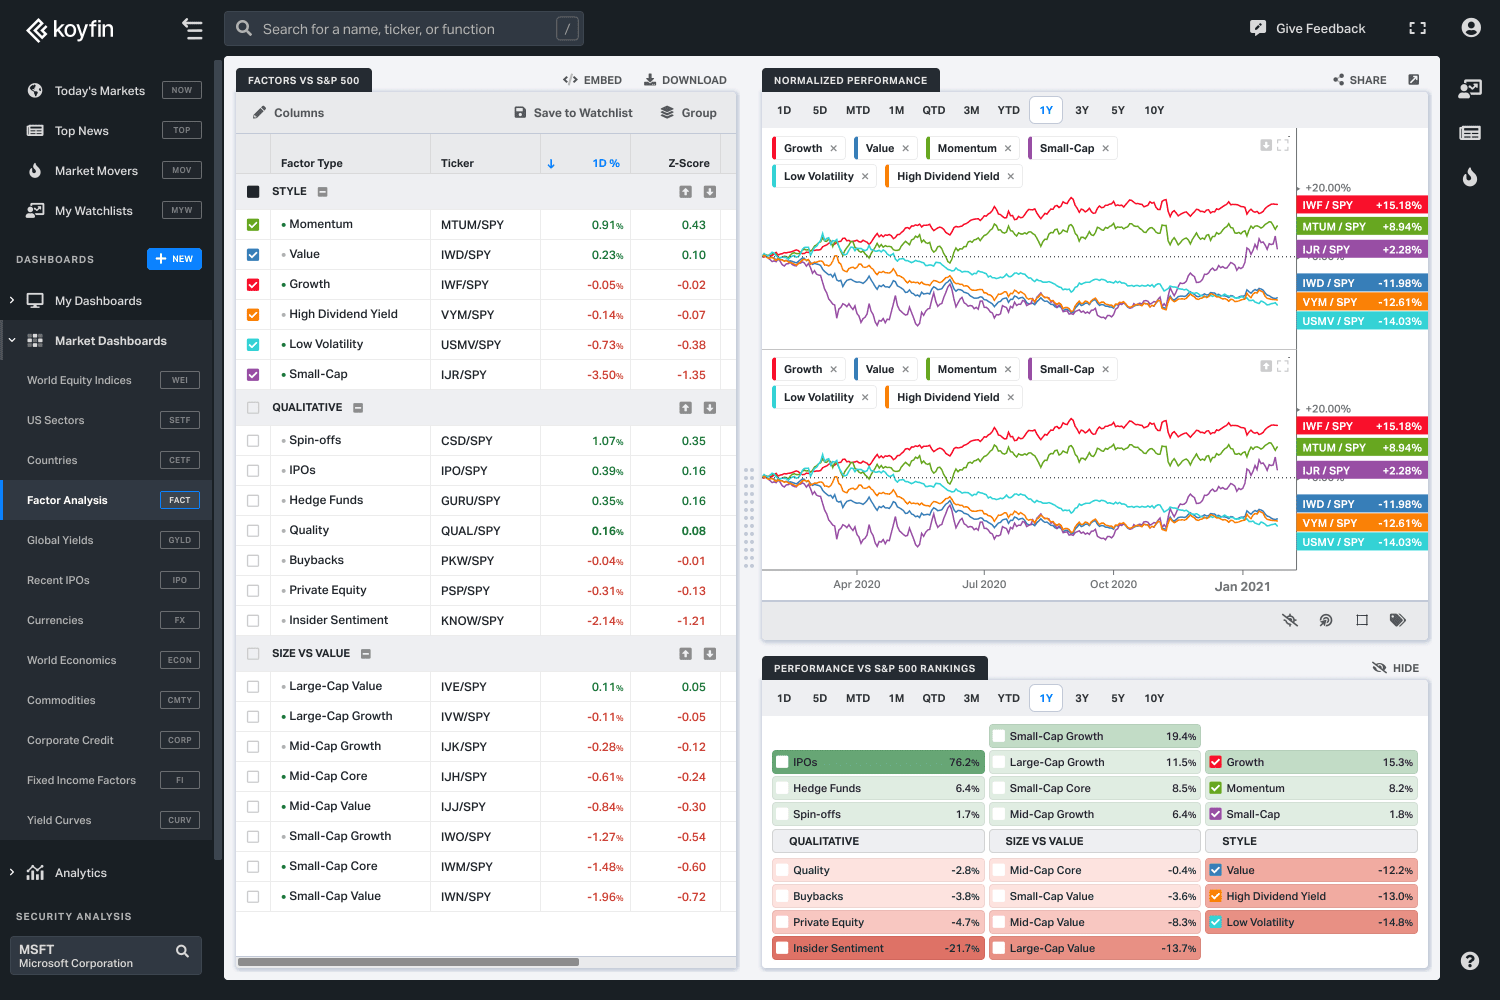
Historical performance
Analyze past performance
Create performance charts to highlight the actual rate of return over any time period. Use presets or tailor the periods as you wish.
Explore our other features
Great investments start with
great insight.
Seize the day with unsurpassed clarity, elegance and depth.